Glance Section
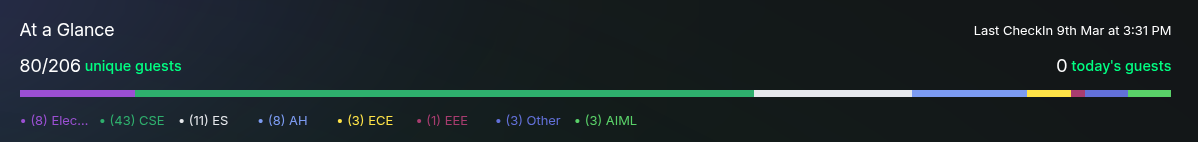
- The check-in count against total registrations, split by category.
- For multi-day check-in events, the check-ins for the current day are also displayed separately.
Graphs
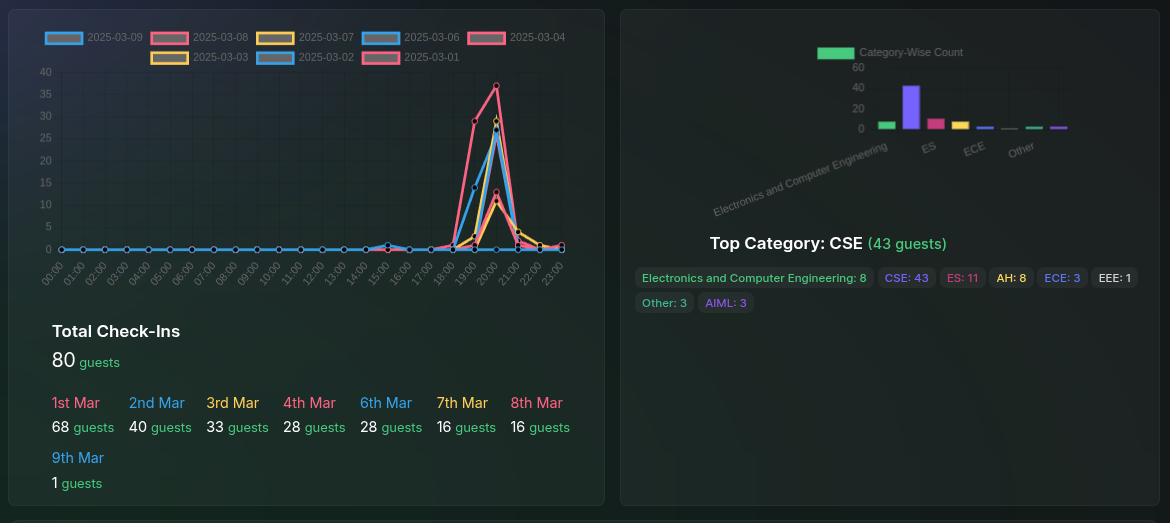
Check-In Trends (Line Graph)
- The first graph is a line graph showing the number of check-ins per hour for the day.
- If the event spans multiple days, multiple lines will be present on the graph, each representing a different day.
- The check-in counts are also displayed below the graph in a readable numeric format.
Category-Wise Check-Ins (Bar Graph)
- The second graph is a bar graph displaying the total number of check-ins per category.
- This is an aggregate graph, meaning it does not categorize data by event date.
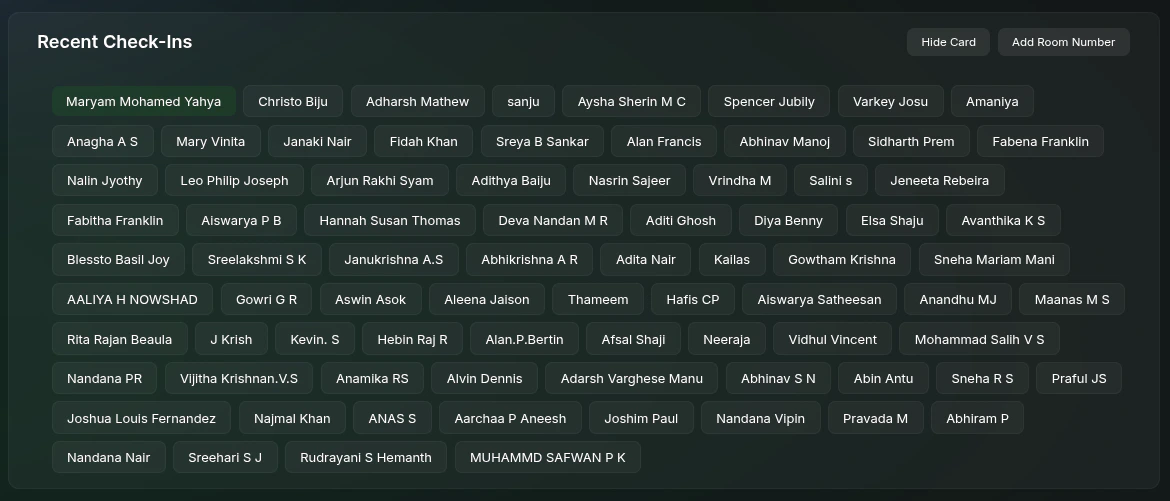
Recent Check-Ins
- A list of the most recent check-ins, displaying guest names in real time.
- A welcome banner automatically pops up when a new check-in occurs.
Unique Room Number
For venues with multiple check-in points, this feature ensures organized guest check-ins:Adding Room Numbers
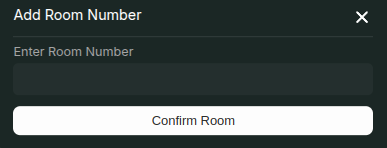
- Click on the Add Room Number button to add a room number.
- In the pop-up, enter the room number.
- Click Add to save the room number.
How It Works
-
Multiple Monitors Setup
- Two separate monitors can be placed in hallways leading to check-in areas.
- Each monitor corresponds to a specific check-in hall.
-
Room Number Assignment
- While scanning, the volunteer can enter the room number.
- The system will display the room number on the monitor.
- The welcome banners are displayed accordingly, ensuring guests are guided to the correct check-in area.